Visualization
Visualization Settings in Jupyter
The pybdshadow` package provide visualization methods based on the visualization plugin provided by kepler.gl.
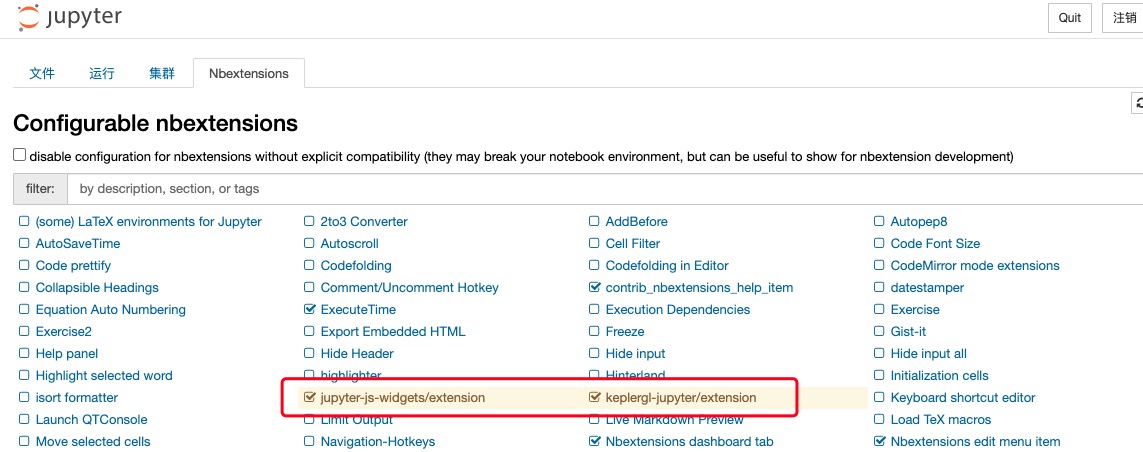
If you want to display the visualization results in jupyter notebook, you need to check the jupyter-js-widgets (which may need to be installed separately) and keplergl-jupyter plugins
Visualization
- pybdshadow.show_bdshadow(buildings=Empty GeoDataFrame Columns: [] Index: [], shadows=Empty GeoDataFrame Columns: [] Index: [], ad=Empty GeoDataFrame Columns: [] Index: [], ad_visualArea=Empty GeoDataFrame Columns: [] Index: [], height='height', zoom='auto')
Visualize the building and shadow with keplergl.
- Parameters:
buildings (GeoDataFrame) – Buildings. coordinate system should be WGS84
shadows (GeoDataFrame) – Building shadows. coordinate system should be WGS84
ad (GeoDataFrame) – Advertisment. coordinate system should be WGS84
ad_visualArea (GeoDataFrame) – Visualarea of Advertisment. coordinate system should be WGS84
height (string) – Column name of building height
zoom (number) – Zoom level of the map
- Returns:
vmap – Visualizations provided by keplergl
- Return type:
keplergl.keplergl.KeplerGl